Dividend Per Share (Sen)
2008 - 12.50
2009 - 15.75
2010 - 13.13
2011 - 9.39
If dividend payout for every quarter for FYE 2012 is 0.1875 x 4 = 7.5 sen per share
share price vs dividend
RM2.110 ~ 3.56%
RM1.800 ~ 4.17%
RM1.700 ~ 4.41%
RM1.500 ~ 5.00%
Nov 28, 2011

Nov 27, 2011
Inventories Valuation and Tax Deductibility
What inventory -related expense is tax deductible ?
- The general principle under Section 33(1) will be applied to determine deductibility of inventory-related expenses i.e.whether the expenses incurred are wholly and exclusively in the production of gross income.
1. Allowance for obsolete or slow moving stocks
An allowance for stock obsolescence is not allowable for tax deduction as it merely represents unrealised loss of an asset of which is contingent in nature.
2. Inventories written off
An actual write off of stock in trade charged to the profit and loss account is
allowable for tax purposes as it is deemed as realised loss. As such, an adjustment is made to the opening stock in trade in the following year.
3. Inventories written down
Stocks write down will be accorded a deduction as it reflects the write down of the cost to its net realisable value. Proper documentation has to be maintained where stocks are written down.
4. Diminution in value of shares as stock in trade
Where shares are the taxpayer’s stock in trade, any diminution in the value of shares to reflect market value is allowable for tax deduction. The diminution in value of the shares should be based on market value and cost of the particular shares.
- The general principle under Section 33(1) will be applied to determine deductibility of inventory-related expenses i.e.whether the expenses incurred are wholly and exclusively in the production of gross income.
1. Allowance for obsolete or slow moving stocks
An allowance for stock obsolescence is not allowable for tax deduction as it merely represents unrealised loss of an asset of which is contingent in nature.
2. Inventories written off
An actual write off of stock in trade charged to the profit and loss account is
allowable for tax purposes as it is deemed as realised loss. As such, an adjustment is made to the opening stock in trade in the following year.
3. Inventories written down
Stocks write down will be accorded a deduction as it reflects the write down of the cost to its net realisable value. Proper documentation has to be maintained where stocks are written down.
4. Diminution in value of shares as stock in trade
Where shares are the taxpayer’s stock in trade, any diminution in the value of shares to reflect market value is allowable for tax deduction. The diminution in value of the shares should be based on market value and cost of the particular shares.
Nov 16, 2011
投资哲理
1.股票投资成败决定于生意眼光,不是决定于预测股市起落的本领。
2.我相信价值,但价值必需有实实在在的财富作为后盾,才能长久存在。没有财富作为后盾的价值,有如建在沙丘上的屋子,最后一定倒塌。
3.股市不是快速致富的地方,通常风险与投资时间的长短成正比。
4.只有长期投资才可以累积财富,因为价值需有财富作后盾才能持久,而创造财富需要时间。
5.反向是最好的投资策略。
6.慢而稳胜过快而狠。
7.最好的投资决定来自个人,不是来自集体。
8.这一组投资哲理,指导了我的投资行为,因此我不相信投机可以致富、不相信没有价值的股票可以长期站稳高价、不相信炒股可以发达、不相信有任何人有预测股市动向(尤其是短期的)的本领。
多阅读投资典籍
研究个别上市公司——越深入越有利。
不了解,就不买。
只要培养正确的投资理念,坚毅不拔,勤做功课,股票投资可以致富。
没盈利,免提-没有盈利的公司,连提都不要去提,更不要说买进了
价值投资法
-有钱赚的公司,是定期分发股息,而股息额又相当稳定的公司
-公司的盈利一年比一年高,股份价值必然也一年比一年高
1. 必须坚守价值投资法,通过股票投资于某种事业,以分享事业成长的成果。
2. 必须勤做功课,研究上市公司,彻底了解所投资企业的实况。
3. 必须长期投资。
4. 必须坚守反向投资策略。
5. 永不投机。
1.不买亏蚀公司的股票,除非是在可以预见的将来可以转亏为盈。
2.不买不派息公司的股票,除非公司具有明显成长潜能。
趁低落实股票店铺化
1. 周息率(D/Y)最好比银行定期存款利率高1倍。目前定存利率为3%多,你所买的视为店铺的股票,周息率(股息回酬率)最好高过6%
2. 必须有适度的成长潜能
3. 购买风险较低的企业股票
4. 用股息买进更多同一只股票,以加速复利增长率
5. 假如你每个月投资500令吉,如果你所买的股票,股息加资本增值,平均每年取得复利增长12%的话,10年后,你将拥有115,019令吉的身家,每年可以收到超过1万令吉的股息。你可以将这只股票视为一间小小的店铺。
周息率如果在8%以上,本益比不超过6倍,股价等于净有形资产,而业务稳定的股票,都值得购买
冷眼
我相信价值投资法,相信脚踏实地是最好的投资方式。
1. 我们是从私人长期投资者的角度评估股票的商业价值,不大理会股市短期波动。
2. 我们喜欢价值,例如以50仙买价值1元的股票,但决不牺牲素质。
3. 我们也喜欢成长股,但价格必须合理(物有所值)。
4. 我们喜欢股息,对于没有派息政策的公司,存有戒心。
5. 我们尽力澈底了解公司,我们访问公司,细读年报和文告,跟他们的对手交谈,了解他们越久越好。
6. 我们通常投资3至15年,但低价买到好公司,也可能永远不卖。
该基金在13年中取得超过13倍的回酬,跟该基金坚持其投资哲理分不开。
阿波罗亚洲基金女投资家Claire Barnes
采取“反向”策略,在股市跌至低潮,股票价值被严重低估时买进,紧握不放
The Safety rules of investing
1. Do not borrow to invest
2. Do not invest all your money
3. Do not invest money you need soon
4. Do not got emotional and panic
5. Do keep investing and stay invested
6. Do diversify
7. Do take professional advice
8. Do give your investment time to grow
2.我相信价值,但价值必需有实实在在的财富作为后盾,才能长久存在。没有财富作为后盾的价值,有如建在沙丘上的屋子,最后一定倒塌。
3.股市不是快速致富的地方,通常风险与投资时间的长短成正比。
4.只有长期投资才可以累积财富,因为价值需有财富作后盾才能持久,而创造财富需要时间。
5.反向是最好的投资策略。
6.慢而稳胜过快而狠。
7.最好的投资决定来自个人,不是来自集体。
8.这一组投资哲理,指导了我的投资行为,因此我不相信投机可以致富、不相信没有价值的股票可以长期站稳高价、不相信炒股可以发达、不相信有任何人有预测股市动向(尤其是短期的)的本领。
多阅读投资典籍
研究个别上市公司——越深入越有利。
不了解,就不买。
只要培养正确的投资理念,坚毅不拔,勤做功课,股票投资可以致富。
没盈利,免提-没有盈利的公司,连提都不要去提,更不要说买进了
价值投资法
-有钱赚的公司,是定期分发股息,而股息额又相当稳定的公司
-公司的盈利一年比一年高,股份价值必然也一年比一年高
1. 必须坚守价值投资法,通过股票投资于某种事业,以分享事业成长的成果。
2. 必须勤做功课,研究上市公司,彻底了解所投资企业的实况。
3. 必须长期投资。
4. 必须坚守反向投资策略。
5. 永不投机。
1.不买亏蚀公司的股票,除非是在可以预见的将来可以转亏为盈。
2.不买不派息公司的股票,除非公司具有明显成长潜能。
趁低落实股票店铺化
1. 周息率(D/Y)最好比银行定期存款利率高1倍。目前定存利率为3%多,你所买的视为店铺的股票,周息率(股息回酬率)最好高过6%
2. 必须有适度的成长潜能
3. 购买风险较低的企业股票
4. 用股息买进更多同一只股票,以加速复利增长率
5. 假如你每个月投资500令吉,如果你所买的股票,股息加资本增值,平均每年取得复利增长12%的话,10年后,你将拥有115,019令吉的身家,每年可以收到超过1万令吉的股息。你可以将这只股票视为一间小小的店铺。
周息率如果在8%以上,本益比不超过6倍,股价等于净有形资产,而业务稳定的股票,都值得购买
冷眼
我相信价值投资法,相信脚踏实地是最好的投资方式。
1. 我们是从私人长期投资者的角度评估股票的商业价值,不大理会股市短期波动。
2. 我们喜欢价值,例如以50仙买价值1元的股票,但决不牺牲素质。
3. 我们也喜欢成长股,但价格必须合理(物有所值)。
4. 我们喜欢股息,对于没有派息政策的公司,存有戒心。
5. 我们尽力澈底了解公司,我们访问公司,细读年报和文告,跟他们的对手交谈,了解他们越久越好。
6. 我们通常投资3至15年,但低价买到好公司,也可能永远不卖。
该基金在13年中取得超过13倍的回酬,跟该基金坚持其投资哲理分不开。
阿波罗亚洲基金女投资家Claire Barnes
采取“反向”策略,在股市跌至低潮,股票价值被严重低估时买进,紧握不放
The Safety rules of investing
1. Do not borrow to invest
2. Do not invest all your money
3. Do not invest money you need soon
4. Do not got emotional and panic
5. Do keep investing and stay invested
6. Do diversify
7. Do take professional advice
8. Do give your investment time to grow
Nov 12, 2011
John Murphy's Ten Laws of Technical Trading
1. Map the Trends
Study long-term charts. Begin a chart analysis with monthly and weekly charts spanning several years. A larger scale "map of the market" provides more visibility and a better long-term perspective on a market. Once the long-term has been established, then consult daily and intra-day charts. A short-term market view alone can often be deceptive. Even if you only trade the very short term, you will do better if you're trading in the same direction as the intermediate and longer term trends.
2. Spot the Trend and Go With It
Determine the trend and follow it. Market trends come in many sizes -- long-term, intermediate-term and short-term. First, determine which one you're going to trade and use the appropriate chart. Make sure you trade in the direction of that trend. Buy dips if the trend is up. Sell rallies if the trend is down. If you're trading the intermediate trend, use daily and weekly charts. If you're day trading, use daily and intra-day charts. But in each case, let the longer range chart determine the trend, and then use the shorter term chart for timing.
3. Find the Low and High of It
Find support and resistance levels. The best place to buy a market is near support levels. That support is usually a previous reaction low. The best place to sell a market is near resistance levels. Resistance is usually a previous peak. After a resistance peak has been broken, it will usually provide support on subsequent pullbacks. In other words, the old "high" becomes the new "low." In the same way, when a support level has been broken, it will usually produce selling on subsequent rallies -- the old "low" can become the new "high."
4. Know How Far to Backtrack
Measure percentage retracements. Market corrections up or down usually retrace a significant portion of the previous trend. You can measure the corrections in an existing trend in simple percentages. A fifty percent retracement of a prior trend is most common. A minimum retracement is usually one-third of the prior trend. The maximum retracement is usually two-thirds. Fibonacci retracements of 38% and 62% are also worth watching. During a pullback in an uptrend, therefore, initial buy points are in the 33-38% retracement area.
5. Draw the Line
Draw trend lines. Trend lines are one of the simplest and most effective charting tools. All you need is a straight edge and two points on the chart. Up trend lines are drawn along two successive lows. Down trend lines are drawn along two successive peaks. Prices will often pull back to trend lines before resuming their trend. The breaking of trend lines usually signals a change in trend. A valid trend line should be touched at least three times. The longer a trend line has been in effect, and the more times it has been tested, the more important it becomes.
6. Follow that Average
Follow moving averages. Moving averages provide objective buy and sell signals. They tell you if existing trend is still in motion and help confirm a trend change. Moving averages do not tell you in advance, however, that a trend change is imminent. A combination chart of two moving averages is the most popular way of finding trading signals. Some popular futures combinations are 4- and 9-day moving averages, 9- and 18-day, 5- and 20-day. Signals are given when the shorter average line crosses the longer. Price crossings above and below a 40-day moving average also provide good trading signals. Since moving average chart lines are trend-following indicators, they work best in a trending market.
7. Learn the Turns
Track oscillators. Oscillators help identify overbought and oversold markets. While moving averages offer confirmation of a market trend change, oscillators often help warn us in advance that a market has rallied or fallen too far and will soon turn. Two of the most popular are the Relative Strength Index (RSI) and Stochastics. They both work on a scale of 0 to 100. With the RSI, readings over 70 are overbought while readings below 30 are oversold. The overbought and oversold values for Stochastics are 80 and 20. Most traders use 14-days or weeks for stochastics and either 9 or 14 days or weeks for RSI. Oscillator divergences often warn of market turns. These tools work best in a trading market range. Weekly signals can be used as filters on daily signals. Daily signals can be used as filters for intra-day charts.
8. Know the Warning Signs
Trade MACD. The Moving Average Convergence Divergence (MACD) indicator (developed by Gerald Appel) combines a moving average crossover system with the overbought/oversold elements of an oscillator. A buy signal occurs when the faster line crosses above the slower and both lines are below zero. A sell signal takes place when the faster line crosses below the slower from above the zero line. Weekly signals take precedence over daily signals. An MACD histogram plots the difference between the two lines and gives even earlier warnings of trend changes. It's called a "histogram" because vertical bars are used to show the difference between the two lines on the chart.
9. Trend or Not a Trend
Use ADX. The Average Directional Movement Index (ADX) line helps determine whether a market is in a trending or a trading phase. It measures the degree of trend or direction in the market. A rising ADX line suggests the presence of a strong trend. A falling ADX line suggests the presence of a trading market and the absence of a trend. A rising ADX line favors moving averages; a falling ADX favors oscillators. By plotting the direction of the ADX line, the trader is able to determine which trading style and which set of indicators are most suitable for the current market environment.
10. Know the Confirming Signs
Include volume and open interest. Volume and open interest are important confirming indicators in futures markets. Volume precedes price. It's important to ensure that heavier volume is taking place in the direction of the prevailing trend. In an uptrend, heavier volume should be seen on up days. Rising open interest confirms that new money is supporting the prevailing trend. Declining open interest is often a warning that the trend is near completion. A solid price uptrend should be accompanied by rising volume and rising open interest.
Study long-term charts. Begin a chart analysis with monthly and weekly charts spanning several years. A larger scale "map of the market" provides more visibility and a better long-term perspective on a market. Once the long-term has been established, then consult daily and intra-day charts. A short-term market view alone can often be deceptive. Even if you only trade the very short term, you will do better if you're trading in the same direction as the intermediate and longer term trends.
2. Spot the Trend and Go With It
Determine the trend and follow it. Market trends come in many sizes -- long-term, intermediate-term and short-term. First, determine which one you're going to trade and use the appropriate chart. Make sure you trade in the direction of that trend. Buy dips if the trend is up. Sell rallies if the trend is down. If you're trading the intermediate trend, use daily and weekly charts. If you're day trading, use daily and intra-day charts. But in each case, let the longer range chart determine the trend, and then use the shorter term chart for timing.
3. Find the Low and High of It
Find support and resistance levels. The best place to buy a market is near support levels. That support is usually a previous reaction low. The best place to sell a market is near resistance levels. Resistance is usually a previous peak. After a resistance peak has been broken, it will usually provide support on subsequent pullbacks. In other words, the old "high" becomes the new "low." In the same way, when a support level has been broken, it will usually produce selling on subsequent rallies -- the old "low" can become the new "high."
4. Know How Far to Backtrack
Measure percentage retracements. Market corrections up or down usually retrace a significant portion of the previous trend. You can measure the corrections in an existing trend in simple percentages. A fifty percent retracement of a prior trend is most common. A minimum retracement is usually one-third of the prior trend. The maximum retracement is usually two-thirds. Fibonacci retracements of 38% and 62% are also worth watching. During a pullback in an uptrend, therefore, initial buy points are in the 33-38% retracement area.
5. Draw the Line
Draw trend lines. Trend lines are one of the simplest and most effective charting tools. All you need is a straight edge and two points on the chart. Up trend lines are drawn along two successive lows. Down trend lines are drawn along two successive peaks. Prices will often pull back to trend lines before resuming their trend. The breaking of trend lines usually signals a change in trend. A valid trend line should be touched at least three times. The longer a trend line has been in effect, and the more times it has been tested, the more important it becomes.
6. Follow that Average
Follow moving averages. Moving averages provide objective buy and sell signals. They tell you if existing trend is still in motion and help confirm a trend change. Moving averages do not tell you in advance, however, that a trend change is imminent. A combination chart of two moving averages is the most popular way of finding trading signals. Some popular futures combinations are 4- and 9-day moving averages, 9- and 18-day, 5- and 20-day. Signals are given when the shorter average line crosses the longer. Price crossings above and below a 40-day moving average also provide good trading signals. Since moving average chart lines are trend-following indicators, they work best in a trending market.
7. Learn the Turns
Track oscillators. Oscillators help identify overbought and oversold markets. While moving averages offer confirmation of a market trend change, oscillators often help warn us in advance that a market has rallied or fallen too far and will soon turn. Two of the most popular are the Relative Strength Index (RSI) and Stochastics. They both work on a scale of 0 to 100. With the RSI, readings over 70 are overbought while readings below 30 are oversold. The overbought and oversold values for Stochastics are 80 and 20. Most traders use 14-days or weeks for stochastics and either 9 or 14 days or weeks for RSI. Oscillator divergences often warn of market turns. These tools work best in a trading market range. Weekly signals can be used as filters on daily signals. Daily signals can be used as filters for intra-day charts.
8. Know the Warning Signs
Trade MACD. The Moving Average Convergence Divergence (MACD) indicator (developed by Gerald Appel) combines a moving average crossover system with the overbought/oversold elements of an oscillator. A buy signal occurs when the faster line crosses above the slower and both lines are below zero. A sell signal takes place when the faster line crosses below the slower from above the zero line. Weekly signals take precedence over daily signals. An MACD histogram plots the difference between the two lines and gives even earlier warnings of trend changes. It's called a "histogram" because vertical bars are used to show the difference between the two lines on the chart.
9. Trend or Not a Trend
Use ADX. The Average Directional Movement Index (ADX) line helps determine whether a market is in a trending or a trading phase. It measures the degree of trend or direction in the market. A rising ADX line suggests the presence of a strong trend. A falling ADX line suggests the presence of a trading market and the absence of a trend. A rising ADX line favors moving averages; a falling ADX favors oscillators. By plotting the direction of the ADX line, the trader is able to determine which trading style and which set of indicators are most suitable for the current market environment.
10. Know the Confirming Signs
Include volume and open interest. Volume and open interest are important confirming indicators in futures markets. Volume precedes price. It's important to ensure that heavier volume is taking place in the direction of the prevailing trend. In an uptrend, heavier volume should be seen on up days. Rising open interest confirms that new money is supporting the prevailing trend. Declining open interest is often a warning that the trend is near completion. A solid price uptrend should be accompanied by rising volume and rising open interest.
Volume Spread Analysis
1) Volume analysis
2) Understanding the market participants, their behaviours and actions
3) Interpreting price with volume
4) Spotting activities of smart money and syndicates
5) Trading with Volume Spread Analysis with Candlestick
2) Understanding the market participants, their behaviours and actions
3) Interpreting price with volume
4) Spotting activities of smart money and syndicates
5) Trading with Volume Spread Analysis with Candlestick
Candlestick Price Analysis
1) Introduction to Candlesticks
2) Types of candlesticks
3) Major candlestick patterns and key signals
4) Spotting trend reversals
5) Spotting high probability low risk entry
6) Preparing to trade on potential entry setups
7) Spotting early exit signals
8) Setting price targets, stop loss level with candlestick chart and calculating reward risk ratio
9) Interpreting the psychology of market participants with candlestick analysis
10)Using technical indicators with candlestick chart
2) Types of candlesticks
3) Major candlestick patterns and key signals
4) Spotting trend reversals
5) Spotting high probability low risk entry
6) Preparing to trade on potential entry setups
7) Spotting early exit signals
8) Setting price targets, stop loss level with candlestick chart and calculating reward risk ratio
9) Interpreting the psychology of market participants with candlestick analysis
10)Using technical indicators with candlestick chart
Analysis of Annual Report
1. 5 years key performance
- revenue, profit before tax, earning per share, dividend per share, return on asset, return on equity, nett tangible asset etc.
2. Chairman and Directors' Report
- highlight the achievement in the year as well as laying out goals, future plan, their strengths and challenges for the future
3. Financial statements-Balance Sheet, Profit and Loss and Cash Flow
- look for the change in performance year-on-year, symptoms of red flags that require investigation and to get answers.
Fundamental analysis to compared with previous financial year to assess the change:
1. Revenue growth
- this should reflect on the earning growth, if all other variables in the earning formula are constant.
2. Gross margin
- this will reflect the profitability of the goods and services of the company.
3. Earning per share
- to calculate the price earning ratio to compare with companies in the similar industry. The company valuation can be computed from this PE ratio. But it is important to update this valuation after every quarterly report. If the company has revenue growth, but without earning growth, it merely means that the increased revenue had not resulted in higher earnings. This can be a red flag and possible reasons could be lower margin, ineffective new investment that generate nore revenues, but had not increased earning per share.
4. Inventories
- ratio of inventory value/revenue. The change is important here, as inventories are tied up capital, and an abnormal increase may indicate problems like rejects or poor quality or poor product mix decisions
5. Receivables
- ratio of of total receivables/revenue - a big increase may mean possible bad debts
6. Cash on hand
- an indicator of financial health as it is the most liquid asset, and the debts status of the company
7. Operating cash flow
- This is directly dependent on the net earnings, and I would say it must be higher than the depreciation value to be considered health
8. Extraordinary gain/loss and impairment loss
- this is the special one time occurrence gain/loss items, and the earnings per share calculation should exclude this figure to reflect fair comparison with other years as well as forecasting the prospect
9. Segmental information
- the assessment of performance of different business segments and their prospects
10. Administrative expenses
- these are the management controllable costs that includes write down of inventories, provision for bad debts and directors remunerations
11. Board members and the management team
- to know their background and experience of management team.
12. Substantial shareholders list
- to see whether there are funds holding the stock.
- revenue, profit before tax, earning per share, dividend per share, return on asset, return on equity, nett tangible asset etc.
2. Chairman and Directors' Report
- highlight the achievement in the year as well as laying out goals, future plan, their strengths and challenges for the future
3. Financial statements-Balance Sheet, Profit and Loss and Cash Flow
- look for the change in performance year-on-year, symptoms of red flags that require investigation and to get answers.
Fundamental analysis to compared with previous financial year to assess the change:
1. Revenue growth
- this should reflect on the earning growth, if all other variables in the earning formula are constant.
2. Gross margin
- this will reflect the profitability of the goods and services of the company.
3. Earning per share
- to calculate the price earning ratio to compare with companies in the similar industry. The company valuation can be computed from this PE ratio. But it is important to update this valuation after every quarterly report. If the company has revenue growth, but without earning growth, it merely means that the increased revenue had not resulted in higher earnings. This can be a red flag and possible reasons could be lower margin, ineffective new investment that generate nore revenues, but had not increased earning per share.
4. Inventories
- ratio of inventory value/revenue. The change is important here, as inventories are tied up capital, and an abnormal increase may indicate problems like rejects or poor quality or poor product mix decisions
5. Receivables
- ratio of of total receivables/revenue - a big increase may mean possible bad debts
6. Cash on hand
- an indicator of financial health as it is the most liquid asset, and the debts status of the company
7. Operating cash flow
- This is directly dependent on the net earnings, and I would say it must be higher than the depreciation value to be considered health
8. Extraordinary gain/loss and impairment loss
- this is the special one time occurrence gain/loss items, and the earnings per share calculation should exclude this figure to reflect fair comparison with other years as well as forecasting the prospect
9. Segmental information
- the assessment of performance of different business segments and their prospects
10. Administrative expenses
- these are the management controllable costs that includes write down of inventories, provision for bad debts and directors remunerations
11. Board members and the management team
- to know their background and experience of management team.
12. Substantial shareholders list
- to see whether there are funds holding the stock.
Analysis of Substantial Shareholders
- assist in picking stocks for trade or invest on long term, and to adopt suitable trading style like position and/or swing trading
- may provide some clues of the market behaviour of a particular listed company
- look at the names of the Institutional Investors and their shareholdings, and the substantial shareholders (5% or more shares)
1) If the company does not have institutional investors
- this company will not be on the radar to be covered by any broker or analyst
- any extraordinary market activities would be from the insiders or individual syndicates whose names may not be in the list of substantial shareholders of 5%, and the retail investor will not know who are the big buyers and sellers.
- reading the price and volume will show that there are speculative and syndicate activities in the stock
- if a retail trader is alert enough to spot those stocks and able to read the chart well, there will be profit opportunities to follow the MM, if there is a syndicate behind the stock.
- if the stock price of a company never moves with volume for years, and reporting steady profits and dividend, that stock does not have syndicate, and the insiders are not interested to "goreng" the stock.
- should be careful as the stock could be fundamentally unattractive for fund participation
2. If the stock has Institutional Funds
- differentiate the type of funds - GLICs (EPF, Tabung Haji, and PNB) or other local and foreign funds.
- GLIC funds (other than EPF which had distributed their investments to various funds for trading) will probably not participating in speculative trading
3. The stocks that are often mentioned by brokers and analysts
- perfect candidates for speculative trading by retail investors because of the high coverage and publicity in newspapers, brokers websites, and internet forums and blogs
- have reasonable fundamentals, and seasonal enough for MM to create theme plays
- analysts will spread news of a theme play, often rotational themes, or any other news that will attract retail investors to participate
- news will be spread around by remisiers, newspapers and internet, retail investors without technical knowledge will probably lose more money after gaining a little
- secret of successful trading in these stocks will be thinking ahead to follow the MM
Category of shareholder
Holding less than 100k
- retail traders and investors
- provide the normal volume of activities in the absence of market makers
- will get excited over tips, research reports and recommendations from analysts, brokers and remisiers
Holding above 100k but less than 5%
- high net worth long term individual investors, unit trust funds, foreign funds, proxies of insiders, syndicate groups and smart money - the market makers and market movers
- move the market and they are the market makers who will feed good or bad news of the company or take advantage of company news and announcements to carry out accumulation or distribution activities
- whenever we see high volume, they are in action, when we see low volume, they are not active, but could be quietly collect stocks that they intend to manipulate
- when we find poor performance in the latest quarterly results, high volume could be due to outflow by funds rather than manipulation by market makers
- if there are news of good results and recommendation by brokers, distribution activities will be coming, as this information would have been taken long time in advance, and accumulations have carried out by the big players
Holding more than 5%
- insiders and government investment linked fund like Khazanah, Tabung Haji, EPF, ASB & PNB
- long term investors for strategic reasons and not likely buy or sell other than transfers
- most insiders have proxies planted in category above to manipulate the market
- may provide some clues of the market behaviour of a particular listed company
- look at the names of the Institutional Investors and their shareholdings, and the substantial shareholders (5% or more shares)
1) If the company does not have institutional investors
- this company will not be on the radar to be covered by any broker or analyst
- any extraordinary market activities would be from the insiders or individual syndicates whose names may not be in the list of substantial shareholders of 5%, and the retail investor will not know who are the big buyers and sellers.
- reading the price and volume will show that there are speculative and syndicate activities in the stock
- if a retail trader is alert enough to spot those stocks and able to read the chart well, there will be profit opportunities to follow the MM, if there is a syndicate behind the stock.
- if the stock price of a company never moves with volume for years, and reporting steady profits and dividend, that stock does not have syndicate, and the insiders are not interested to "goreng" the stock.
- should be careful as the stock could be fundamentally unattractive for fund participation
2. If the stock has Institutional Funds
- differentiate the type of funds - GLICs (EPF, Tabung Haji, and PNB) or other local and foreign funds.
- GLIC funds (other than EPF which had distributed their investments to various funds for trading) will probably not participating in speculative trading
3. The stocks that are often mentioned by brokers and analysts
- perfect candidates for speculative trading by retail investors because of the high coverage and publicity in newspapers, brokers websites, and internet forums and blogs
- have reasonable fundamentals, and seasonal enough for MM to create theme plays
- analysts will spread news of a theme play, often rotational themes, or any other news that will attract retail investors to participate
- news will be spread around by remisiers, newspapers and internet, retail investors without technical knowledge will probably lose more money after gaining a little
- secret of successful trading in these stocks will be thinking ahead to follow the MM
Category of shareholder
Holding less than 100k
- retail traders and investors
- provide the normal volume of activities in the absence of market makers
- will get excited over tips, research reports and recommendations from analysts, brokers and remisiers
Holding above 100k but less than 5%
- high net worth long term individual investors, unit trust funds, foreign funds, proxies of insiders, syndicate groups and smart money - the market makers and market movers
- move the market and they are the market makers who will feed good or bad news of the company or take advantage of company news and announcements to carry out accumulation or distribution activities
- whenever we see high volume, they are in action, when we see low volume, they are not active, but could be quietly collect stocks that they intend to manipulate
- when we find poor performance in the latest quarterly results, high volume could be due to outflow by funds rather than manipulation by market makers
- if there are news of good results and recommendation by brokers, distribution activities will be coming, as this information would have been taken long time in advance, and accumulations have carried out by the big players
Holding more than 5%
- insiders and government investment linked fund like Khazanah, Tabung Haji, EPF, ASB & PNB
- long term investors for strategic reasons and not likely buy or sell other than transfers
- most insiders have proxies planted in category above to manipulate the market
When to Sell a Stock
1) Sell when you are wrong出错
- news that may have negative impact on the future value of the company
2) Sell when the grass in greener elsewhere
- the growth and prospect of the industry is less attractive than others
3) Sell when the price is far above the fair value
- buy stocks at a discount over the intrinsic value, sell when the price is above the fair value or the length of time it take to reach intrinsic value
4) Sell when original factors of stock selection have changed
- valuation and assumptions had changed, earnings were not within expectations, red flags like decline in revenue and increased costs, change of management, or new government regulations etc
Once decided not to hold the stock, look at the technical aspects to choose the timing of to sell. If the sign shows the stock is moving down, sell off, even at a loss. If the stock is on uptrend, wait for the exit signals to trigger the disposal. But once you have made a fundamental decision, stick to it and act resolutely.
何时卖股
1. 公司亏损,尤其是持续亏损
2. 极度高估
要把有关股票,分为高、中、低成长股。
高成长股,应享有较高的本益比,低成长股,应享有较低的本益比。不应将本益比应用于所有股票,不分高、中、低成长股,而作出错误的判断。
3. 更佳选择
- 看公司的盈利纪录,最好比较10年的纪录,从纪录可以看出公司业务的趋势及稳定性。如果其他条件相同,选择业务及盈利稳定的公司。
-比较同类公司的表现,即使是同一个行业,公司表现也参差不齐,决定的因素很多,最好选择表现亮丽及市场份额稳定的公司。以公司的素质,而不是以股价为标准。
- 比较各行业的前景,以行业的景气为指南,尤其是周期性很明显的行业,应在最不景气时买进,景气最旺时脱售。
- 投资原则是:成长一般的股票,本益比若走到15倍以上,就不再买进,20倍以上,就毫不犹豫的脱售。
投资成功例子:反向+成长+时间=财富
- news that may have negative impact on the future value of the company
2) Sell when the grass in greener elsewhere
- the growth and prospect of the industry is less attractive than others
3) Sell when the price is far above the fair value
- buy stocks at a discount over the intrinsic value, sell when the price is above the fair value or the length of time it take to reach intrinsic value
4) Sell when original factors of stock selection have changed
- valuation and assumptions had changed, earnings were not within expectations, red flags like decline in revenue and increased costs, change of management, or new government regulations etc
Once decided not to hold the stock, look at the technical aspects to choose the timing of to sell. If the sign shows the stock is moving down, sell off, even at a loss. If the stock is on uptrend, wait for the exit signals to trigger the disposal. But once you have made a fundamental decision, stick to it and act resolutely.
何时卖股
1. 公司亏损,尤其是持续亏损
2. 极度高估
要把有关股票,分为高、中、低成长股。
高成长股,应享有较高的本益比,低成长股,应享有较低的本益比。不应将本益比应用于所有股票,不分高、中、低成长股,而作出错误的判断。
3. 更佳选择
- 看公司的盈利纪录,最好比较10年的纪录,从纪录可以看出公司业务的趋势及稳定性。如果其他条件相同,选择业务及盈利稳定的公司。
-比较同类公司的表现,即使是同一个行业,公司表现也参差不齐,决定的因素很多,最好选择表现亮丽及市场份额稳定的公司。以公司的素质,而不是以股价为标准。
- 比较各行业的前景,以行业的景气为指南,尤其是周期性很明显的行业,应在最不景气时买进,景气最旺时脱售。
- 投资原则是:成长一般的股票,本益比若走到15倍以上,就不再买进,20倍以上,就毫不犹豫的脱售。
投资成功例子:反向+成长+时间=财富
Gems in the Market
- low media or analyst attention, hidden from the herd and being neglected
- very much undervalued with low PE ratio
- low volatility in the absence of theme play by SM and brokers
- constant dividend stream with slow capital gains, until the time when SM participates to create high volume, pushing up to higher price approaching the intrinsic value of the stock
- relatively safe for conservative investors because of its undemanding low PE, and it may reap high rewards for patience investor who can hold for a long term
- have to be sold when its market value rises to the intrinsic value when fundamental investors and fund managers holding them may want to realize their gains
Criteria
1) The Business
- products/services, supply and demand, competitions, growth prospects, M&A target
2) The Financials
- revenue stream, operating cash flow, debt, EPS, dividend stream
3) The Shareholders
- owner shareholdings, trading by insiders, institutional investors
4) The Price/Volume History
- liquity, trading volume, price volatility
- very much undervalued with low PE ratio
- low volatility in the absence of theme play by SM and brokers
- constant dividend stream with slow capital gains, until the time when SM participates to create high volume, pushing up to higher price approaching the intrinsic value of the stock
- relatively safe for conservative investors because of its undemanding low PE, and it may reap high rewards for patience investor who can hold for a long term
- have to be sold when its market value rises to the intrinsic value when fundamental investors and fund managers holding them may want to realize their gains
Criteria
1) The Business
- products/services, supply and demand, competitions, growth prospects, M&A target
2) The Financials
- revenue stream, operating cash flow, debt, EPS, dividend stream
3) The Shareholders
- owner shareholdings, trading by insiders, institutional investors
4) The Price/Volume History
- liquity, trading volume, price volatility
Nov 3, 2011
Appreciation of Practical Taxation for Beginners
Course outline
1) Income Tax Act 1965
2) Introduction to Taxation
3) Self-Assesment
4) Residence Status
5) Basis Period
6) Income
-Business
-Non-Business Income
-Taxable Income & Non Taxable Income
7) Deductions
-Allowable Deduction
-Non-Deductible Expenses
-Prohibited Expenditure
8) Capital Allowance
-Initial & Annual Allowance
-Balancing Charge & Allowance
-Control Transfer
9) Business Loss
10)Dividend
-Tax imputation System
-Single tier System
11)Witholding Tax
12)Tax Audit & Investigation
-Audit
-Investigation
1) Income Tax Act 1965
2) Introduction to Taxation
3) Self-Assesment
4) Residence Status
5) Basis Period
6) Income
-Business
-Non-Business Income
-Taxable Income & Non Taxable Income
7) Deductions
-Allowable Deduction
-Non-Deductible Expenses
-Prohibited Expenditure
8) Capital Allowance
-Initial & Annual Allowance
-Balancing Charge & Allowance
-Control Transfer
9) Business Loss
10)Dividend
-Tax imputation System
-Single tier System
11)Witholding Tax
12)Tax Audit & Investigation
-Audit
-Investigation
Oct 23, 2011
COASTAL - Basic Fundamental Analysis
Sector:- construction
Financial Year End:- 31 December
Listed on Main Board of Bursa Malaysia Securities Berhad in
Principle activities:-
- shipbuilding, ship/vessel chartereing

 1. It has an excellent track record of making increasing profits in the last few years.
2. For the fourth consecutive year, Coastal was awarded Forbes’ “Asia 200 Best Under a Billion” in 2007, 2008, 2009 and again in 2010.
-orderbook RM743m 21/09/12
Financial Year End:- 31 December
Listed on Main Board of Bursa Malaysia Securities Berhad in
Principle activities:-
- shipbuilding, ship/vessel chartereing
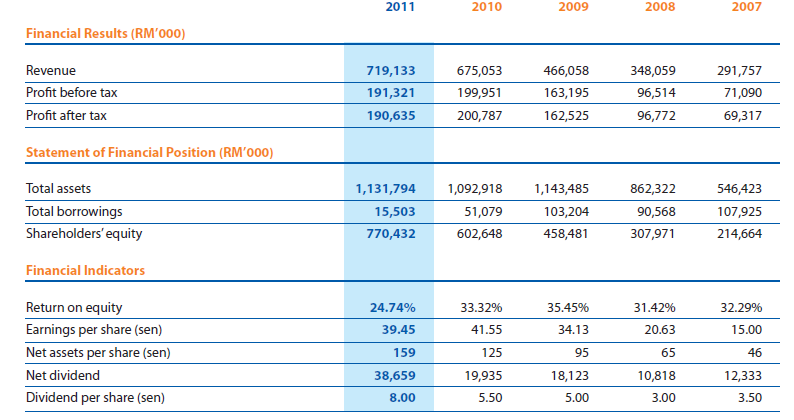

2. For the fourth consecutive year, Coastal was awarded Forbes’ “Asia 200 Best Under a Billion” in 2007, 2008, 2009 and again in 2010.
-orderbook RM743m 21/09/12
Budget Commentary 2012
A2 Income Tax - Changes affecting individuals
A2.1 Preferential tax rate for returning experts
-tax at flat rate of 15% for 5 years
-w.e.f Ya2012
A2.2 Seperate tax relief of RM3k for contribution to PRS and Deferred Annuity
-w.e.f Ya2012 to 2021
A3 Income Tax - Changes affecting companies
A3.2 Tax deduction on franchise fee for local franchise brands
-expenses incurred by franchise business e.g royalty,promotion and advertisement fees, training fees and service fees allowed as tax deduction
-franchise fees are arguably capital expenditure case Shaklee
-w.e.f Ya2012
A3.4 Deduction on contribution to private retirement scheme (PRS)
-tax deduction on the contribution by employers to PRS
-w.e.f Ya2012
A3.5 Compensation for late refund of income tax
-2% on amount refund after 90 days from due date for electronic filling, 120 days from due date for manual filling
-w.e.f Ya2013
A3.9 Double deduction for structured intership programme
-full time undergraduate student
-minimum 10 weeks with monthly allowance > RM500
-w.e.f Ya2012 untill 2016
A3.10 Double deduction for scholarships
-full time student
-have no sources of income
-total monthly income of parents or guardian does not exceed RM5k
-w.e.f Ya2012 untill 2016
A3.11 Double deduction of expenses for participation in career fairs abroad
-w.e.f Ya2012 untill 2016
A.3.13 Time bar for tax audit reduced from 6 years to 5 years
-w.e.f Ya2013
A5 Stamp Duty
A5.1 Full stamp duty exemption on loan agreement for purchase of residential properties under the skim Perumahan Raykat 1Malaysia (PR1MA) priced up to RM300k
-w.e.f 1/1/2012 to 31/12/2016
A5.2 Stamp duty exemption on loan agreement for micro finance and professional services fund
-100% stamp duty exemption for loan agreement up to RM50k
-w.e.f 1/1/2012
A8 Real Property Gain Tax
A8.1 Disposal of residential, commercial properties and share in real property companies which holding Period < 2 years-10%, 2-5 years-5%, more than 5 years-0%
-RPGT exemption for disposal one property per individual
-RPGT exemption for disposal within family member
-RPGT on net profit after deduct all the expenses e.g legal fee,stamp duty
-exemption up to RM10k or 10% from the net profit which ever higher for individual
-w.e.f 1/1/2012
A2.1 Preferential tax rate for returning experts
-tax at flat rate of 15% for 5 years
-w.e.f Ya2012
A2.2 Seperate tax relief of RM3k for contribution to PRS and Deferred Annuity
-w.e.f Ya2012 to 2021
A3 Income Tax - Changes affecting companies
A3.2 Tax deduction on franchise fee for local franchise brands
-expenses incurred by franchise business e.g royalty,promotion and advertisement fees, training fees and service fees allowed as tax deduction
-franchise fees are arguably capital expenditure case Shaklee
-w.e.f Ya2012
A3.4 Deduction on contribution to private retirement scheme (PRS)
-tax deduction on the contribution by employers to PRS
-w.e.f Ya2012
A3.5 Compensation for late refund of income tax
-2% on amount refund after 90 days from due date for electronic filling, 120 days from due date for manual filling
-w.e.f Ya2013
A3.9 Double deduction for structured intership programme
-full time undergraduate student
-minimum 10 weeks with monthly allowance > RM500
-w.e.f Ya2012 untill 2016
A3.10 Double deduction for scholarships
-full time student
-have no sources of income
-total monthly income of parents or guardian does not exceed RM5k
-w.e.f Ya2012 untill 2016
A3.11 Double deduction of expenses for participation in career fairs abroad
-w.e.f Ya2012 untill 2016
A.3.13 Time bar for tax audit reduced from 6 years to 5 years
-w.e.f Ya2013
A5 Stamp Duty
A5.1 Full stamp duty exemption on loan agreement for purchase of residential properties under the skim Perumahan Raykat 1Malaysia (PR1MA) priced up to RM300k
-w.e.f 1/1/2012 to 31/12/2016
A5.2 Stamp duty exemption on loan agreement for micro finance and professional services fund
-100% stamp duty exemption for loan agreement up to RM50k
-w.e.f 1/1/2012
A8 Real Property Gain Tax
A8.1 Disposal of residential, commercial properties and share in real property companies which holding Period < 2 years-10%, 2-5 years-5%, more than 5 years-0%
-RPGT exemption for disposal one property per individual
-RPGT exemption for disposal within family member
-RPGT on net profit after deduct all the expenses e.g legal fee,stamp duty
-exemption up to RM10k or 10% from the net profit which ever higher for individual
-w.e.f 1/1/2012
Oct 2, 2011
Public Mutual New Switching Fee Structure
1. Switching within 90 days from date of purchase

-Equity/balanced funds - 0.75% or minimum RM50 per transaction
-Bond funds - 0.25% or minimum RM50 per transaction
-Money market funds - RM50 per transaction
2. Switching after 90 days from date of purchase

-Equity/balanced funds - RM25 per transaction
-Bond funds - RM25 per transaction
-Money market funds - free
# Loaded units are units which have incurred a service charge of 3% or more at the point of purchase
## Low-load units are units which have incurred a service charge of 0.25% or less at the point of purchase

-Equity/balanced funds - 0.75% or minimum RM50 per transaction
-Bond funds - 0.25% or minimum RM50 per transaction
-Money market funds - RM50 per transaction
2. Switching after 90 days from date of purchase

-Equity/balanced funds - RM25 per transaction
-Bond funds - RM25 per transaction
-Money market funds - free
# Loaded units are units which have incurred a service charge of 3% or more at the point of purchase
## Low-load units are units which have incurred a service charge of 0.25% or less at the point of purchase
Aug 14, 2011
MUDAJAYA - Basic Fundamental Analysis


Aug 13, 2011
Return on Equity (ROE)
The amount of net income returned as a percentage of shareholders equity. Return on equity measures a corporation's profitability by revealing how much profit a company generates with the money shareholders have invested.
Returns on Equity (ROE) = Net Profit/Shareholder's Equit
EPS Growth Rate (EPS GR)
3. Gearing Ratio
4. Net Profit Margin
Intrinsic Value
a stock is really worth - as opposed to the value at which it is being traded in the marketplace
If intrinsic value > current share price = undervalue make sense to buy
& Fair Value
6. Dividend Yield & Dividend Policy
7. Good Management & Competitive Advantage
Returns on Equity (ROE) = Net Profit/Shareholder's Equit
EPS Growth Rate (EPS GR)
3. Gearing Ratio
4. Net Profit Margin
Intrinsic Value
a stock is really worth - as opposed to the value at which it is being traded in the marketplace
If intrinsic value > current share price = undervalue make sense to buy
& Fair Value
6. Dividend Yield & Dividend Policy
7. Good Management & Competitive Advantage
Aug 12, 2011
PR 1/2010 Withholding Tax on Income under Paragraph 4(f)
- Effective 01.01.2009 with the introduction of new section 109F of ITA
Criteria to determine a payment fall under Paragraph 4(f)
(a) the payment is revenue and not capital in nature;
(b) the payment is not income that falls under paragraphs 4(a) to 4(e) and section 4A of the ITA;
(c) the payment received by a non-resident person is in the nature of a miscellaneous income. Such income is often casual in nature. Casual income means an occasional income, which is received outside the ordinary course of trade or vocation;
(d) the payment is for an isolated transaction; and
(e) there is an absence of repetition of transactions to indicate the commercial nature of the transaction.
Gains or profits under Paragraph 4(f) of the ITA deemed to be derived from Malaysia irrespective of whether transactions are carried on in Malaysia or not
e.g. commission, guarantee fees
Form CP37F – Section 109F, ITA –Payment to a non-resident chargeable under Paragraph 4(f) ITA
Criteria to determine a payment fall under Paragraph 4(f)
(a) the payment is revenue and not capital in nature;
(b) the payment is not income that falls under paragraphs 4(a) to 4(e) and section 4A of the ITA;
(c) the payment received by a non-resident person is in the nature of a miscellaneous income. Such income is often casual in nature. Casual income means an occasional income, which is received outside the ordinary course of trade or vocation;
(d) the payment is for an isolated transaction; and
(e) there is an absence of repetition of transactions to indicate the commercial nature of the transaction.
Gains or profits under Paragraph 4(f) of the ITA deemed to be derived from Malaysia irrespective of whether transactions are carried on in Malaysia or not
e.g. commission, guarantee fees
Form CP37F – Section 109F, ITA –Payment to a non-resident chargeable under Paragraph 4(f) ITA
PR 4/2005 Withholding Tax on Special Classes of Income
Special classes of income chargeable to tax
1. Paragraph 4(A)(i) of ITA - Services rendered in connection with the use or installation or operation of assets
a) Provision of personnel for advisory or supervisory services
b) Installation and commissioning services
2. Paragraph 4(A)(ii) of ITA - Technical advice, assistance or services rendered in connection with technical management or administration
a) Management or marketing services
b) Consultancy service
c) Legal services in connection with a debt or agency arrangement
d) Inter-company technical services
e) Specially-tailored training course
Form CP37D – Section 109B, ITA -Payment to a non-resident chargeable under Paragraph 4A
3. Paragraph 4(A)(iii) of ITA - Rent of other payment for use of moveable property
(for use of oil rigs, boats, ships, cars, aircraft or other equipment)
a) Slot hire
b) Leasing of ships
c) Time charter
d) Voyage charter
Income under Paragraph 4A(i) and 4A(ii) are deemed derived from Malaysia if such services are performed in Malaysia
2nd addendum to PR 4/2005 Withholding Tax on Special Classes of Income
w.ef. 01.01.2009 reimbursement or disbursement on hotel accommodation is not subject to withholding tax
1. Paragraph 4(A)(i) of ITA - Services rendered in connection with the use or installation or operation of assets
a) Provision of personnel for advisory or supervisory services
b) Installation and commissioning services
2. Paragraph 4(A)(ii) of ITA - Technical advice, assistance or services rendered in connection with technical management or administration
a) Management or marketing services
b) Consultancy service
c) Legal services in connection with a debt or agency arrangement
d) Inter-company technical services
e) Specially-tailored training course
Form CP37D – Section 109B, ITA -Payment to a non-resident chargeable under Paragraph 4A
3. Paragraph 4(A)(iii) of ITA - Rent of other payment for use of moveable property
(for use of oil rigs, boats, ships, cars, aircraft or other equipment)
a) Slot hire
b) Leasing of ships
c) Time charter
d) Voyage charter
Income under Paragraph 4A(i) and 4A(ii) are deemed derived from Malaysia if such services are performed in Malaysia
2nd addendum to PR 4/2005 Withholding Tax on Special Classes of Income
w.ef. 01.01.2009 reimbursement or disbursement on hotel accommodation is not subject to withholding tax
Aug 7, 2011
PR 3/2011 Investment Holding Companies (IHC)
A company whose activities consists 80% of its gross income is derived from holding of investment (interest, dividend, rental). In relation to rental income, rental which is derived by providing maintenance or support services are excluded from being treated as investment income
Determination of an investment holding company
a) its main activity is the holding of investments;
b) not less than 80% of the company’s gross income (whether exempt or not) is derived from the holding of those investments.
Permitted expenses incurred by IHC under Section 60F
1)Director’s fees
2)Wages, salaries and allowances (EPF & Socso not included)
3)Management fees
4)Secretarial, audit and accounting fees, telephone charges
5)Printing and stationery costs and postage
6)Rent and other expenses incidental to the maintenance of an office
A x B/4C
A = permitted expenses
B = gross income (dividend, interest and rental)
C = aggregate of the gross income
Amount allowable as deductible should be lower of A x B/4C or 5% of total gross income (C)
- income of IHC listed in Bursa Securities will be treated as business income , given full tax deduction
Public Ruling No. 3/2011_10/03/2011
Malaysia Master Tax Guide 2009 – Pg 13-570
Determination of an investment holding company
a) its main activity is the holding of investments;
b) not less than 80% of the company’s gross income (whether exempt or not) is derived from the holding of those investments.
Permitted expenses incurred by IHC under Section 60F
1)Director’s fees
2)Wages, salaries and allowances (EPF & Socso not included)
3)Management fees
4)Secretarial, audit and accounting fees, telephone charges
5)Printing and stationery costs and postage
6)Rent and other expenses incidental to the maintenance of an office
A x B/4C
A = permitted expenses
B = gross income (dividend, interest and rental)
C = aggregate of the gross income
Amount allowable as deductible should be lower of A x B/4C or 5% of total gross income (C)
- income of IHC listed in Bursa Securities will be treated as business income , given full tax deduction
Public Ruling No. 3/2011_10/03/2011
Malaysia Master Tax Guide 2009 – Pg 13-570
Subscribe to:
Posts (Atom)